APAS/Wizard Statistics
Go Back
Statisticians use the Greek letter alpha () to indicate the probability of
rejecting the statistical hypothesis tested when in fact, that hypothesis is
true. Before conducting any statistical test, it is important to establish a
value for alpha. For most psychologists, and for many other scientists, it is
customary to set alpha at 0.05.
This is the equivalent of asserting that you will reject the hypothesis
tested if the obtained statistic is among those that would occur only 5 out of
100 times that random samples are drawn from a population in which the
hypothesis is true. If your obtained statistic leads you to reject the
hypothesis tested, it's not because you believe that the obtained statistic
could not have occurred by chance.
It's that you are asserting that the odds of obtaining that statistic by
chance only are sufficiently low (one out of twenty) that it reasonable to
conclude that your results are not due to chance. Could you be in error? Of
course you could, but at least you know the probability of such an error. It is
exactly equal to the value you have previously established for alpha.
Go Back
The test of a given statistical hypothesis entails an assessment of whether
or not our sample (or samples) have yielded a statistic that is among those
cases that would only occur alpha proportion of the time if the hypothesis
tested is true.
In these circumstances we know the probability of rejecting the hypothesis
tested when it is true (that probability is equal to alpha) but unless we have
also specified an alternative hypothesis to the hypothesis tested, we have no
idea of the probability of being in error, if our test has failed to yield a
value that enables us to reject the hypothesis tested.
Go Back
Statisticians use the Greek letter beta () to indicate the probability of
failing to reject the hypothesis tested when that hypothesis is false and a
specific alternative hypothesis is true. For a given test, the value of beta is
determined by the previously elected value of alpha, certain features of the
statistic that is being calculated (particularly the sample size) and the
specific alternative hypothesis that is being entertained. While it is possible
to carry out a statistical test without entertaining a specific alternative
hypothesis, neither beta nor power can be calculated if there is no specific
alternative hypothesis. It is relevant to note here that power ( the probability
that the test will reject the hypothesis tested when a specific alternative
hypothesis is true ) is always equal to one minus beta (i.e. Power = 1 - beta).
Standard deviation / mean...
Go Back
Go Back
Go Back
Go Back
Go Back
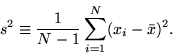
Statisticians use the terms "degrees of freedom" to describe the number of
values in the final calculation of a statistic that are free to vary. Consider,
for example the statistic s-square.
To calculate the s-square of a random sample, we must first calculate the
mean of that sample and then compute the sum of the several squared deviations
from that mean. While there will be n such squared deviations only (n - 1) of
them are, in fact, free to assume any value whatsoever. This is because the
final squared deviation from the mean must include the one value of X such that
the sum of all the Xs divided by n will equal the obtained mean of the sample.
All of the other (n - 1) squared deviations from the mean can, theoretically,
have any values whatsoever. For these reasons, the statistic s-square is said to
have only (n - 1) degrees of freedom.
Go Back
TODO...
Go Back
The mean of a random sample is an unbiased estimate of the mean of the
population from which it was drawn. Another way to say this is to assert that
regardless of the size of the population and regardless of the size of the
random sample, it can be shown (through The Central Limit Theorem) that if we
repeatedly took random samples of the same size from the same population, the
sample means would cluster around the exact value of the population mean.
Go Back
TODO...
Go Back
The null hypothesis being tested is that the Examinee performs "at
least as good" as the Norm.
The null hypothesis is a term that statisticians often use to indicate the
statistical hypothesis tested. The purpose of most statistical tests, is to
determine if the obtained results provide a reason to reject the hypothesis that
they are merely a product of chance factors. For example, in an experiment in
which two groups of randomly selected subjects have received different
treatments and have yielded different means, it is always necessary to ask if
the difference between the obtained means is among the differences that would be
expected to occure by chance whenever two groups are randomly selected. In this
example, the hypothesis tested is that the two samples are from populations with
the same mean. Another way to say this is to assert that the investigator tests
the null hypothesis that the difference between the means of the populations
from which the samples were drawn, is zero. If the difference between the means
of the samples is among those that would occur rarely by chance when the null
hypothesis is true, the null hypothesis is rejected and the investigator
describes the results as statistically significant.
Go Back
The null hypothesis being tested is that the Examinee
performs "at least as good" on the tested side as on the opposing side. For more
information see H0.
Go Back
The level of confidence ... = 1 - alpha.
Go Back
The mean is one of several indices of central tendency that statisticians use
to indicate the point on the scale of measures where the population is centered.
The mean is the average of the scores in the population. Numerically, it
equals the sum of the scores divided by the number of scores. It is of interest
that the mean is the one value which, if substituted for every score in a
population, would yield the same sum as the original scores, and hence it would
yield the same mean.
Go Back
Statisticians define a population as the entire collection of items that is
the focus of concern. The branch of Statistics called "Descriptive Statistics"
provides us with ways to describe the characteristics of a given population by
measuring each of its items and then summarizing the set of measures in various
ways.
The branch of Statistics called "Inferential Statistics" consists of procedures
to make educated inferences about the characteristics of a population by drawing
a random sample and appropriately analyzing the information it provides.
A population can be of any size and while the items need not be uniform, the
items must share at least one measurable feature. For example here is a
population of 9 persons. While no two of the persons are identical they have
many features in common. Each of the persons in this population has a weight, a
height, a hat size and a shoe size, among many other potential features. The set
of 9 measurements of any one of these features would, in statistical terms, be
defined as a population.
The critical difference between a population and a sample, is that with a
population our interest is to identify its characteristics whereas with a
sample, our interest is to make inferences about the characteristics of the
population from which the sample was drawn.
Go Back
For a statistician, the power of a test is the probability that the test will
reject the hypothesis tested when a specific alternative hypothesis is true. To
calculate the power of a given test it is necessary to specify alpha (the
probability that the test will lead to the rejection of the hypothesis tested
when that hypothesis is true) and to specify a specific alternative hypothesis.
Go Back
Go Back
Go Back
Go Back
The standard deviation is one of several indices of variability that
statisticians use to characterize the dispersion among the measures in a given
population.
To calculate the standard deviation of a population it is first necessary to
calculate that population's variance. Numerically, the standard deviation is the
square root of the variance. Unlike the variance, which is a somewhat abstract
measure of variability, the standard deviation can be readily conceptualized as
a distance along the scale of measurement.
Student T-Test
Go Back
The Student T-Test employs the statistic (t) to test a given statistical
hypothesis about the mean of a population (or about the means of two
populations). A one-sided t-test is used to test if the sample mean is
significantly different from a particular value:

With s:
Check here for more information
Go Back
An
indication of how consistent the examinee was in performing the test.
Go Back
This statistic is a measure on a random sample (or pair of samples) in which
a mean (or pair of means) appears in the numerator and an estimate of the
numerator's standard deviation appears in the denominator. The later estimate is
based on the calculated s square or s squares of the samples.
If these calculations yield a value of (t) that is sufficiently different
from zero, the test is considered to be statistically significant.
Type I Error
Go Back
You have committed a Type One error if you have rejected the hypothesis
tested when it was true.
In a given statistical test, the probability of a type 1 error is equal to
the value you have set for alpha.
Type II Error
Go Back
You have committed a Type II error if you failed to reject the hypothesis
tested when a given alternative hypothesis was true.
In a given statistical test, the probability of a type II error is equal to
the value calculated for Beta.