Initializing...
Home
  • Home
  • Performance Analysis
    • Introduction
    • Features
    • Advantages
    • References
    • Gallery
    • Downloads
    • Installation
    • Buy
    • More...
  • Exercise Machines
    • Introduction
    • Features
    • Advantages
    • Exercises
    • References
    • Gallery
    • Buy
    • More...
  • Products
    • Downloads
    • Manuals
    • Price List
    • APAS 2020 - Standard Edition
    • APAS 2020 - Premium Edition
    • APAS 2020 - A/D Workstation
    • ACES 2020 - Multifunction Machine
    • ACES 2020 - Arm/Leg Machine
  • Library
    • Applications
    • Archives
    • Articles
    • Documentation
    • Downloads
    • Journals
    • Manuals
    • Presentations
    • Tutorials
    • Videos
    • More...
  • Company
    • About
    • Activities
    • Contact
    • Founder
    • History
    • Presentations
    • More...
  • Personal
    • Books
    • Wikipedia
    • Facebook
    • Youtube
      • Dream Factory
      • Personal
    • Flickr
      • Recent Additions
      • All Collections
      • All Albums
      • Tags
    • Photo Galleries
      • Recent Additions
      • Locations
      • Rated 5 Stars
      • Rated 4 Stars
      • Rated 3 Stars
    • Administration
    • More...
  • External links
    • Ariel Astro
    • More information
  • 70

    Computerized Exercise System

    Ariel Dynamics is proud to introduce the new generation of the revolutionary ACES (Ariel Computerized Exercise System), the most unique system and advanced exercise technology on the market today.
  • 69

    Performance Analysis System

    The Ariel Performance Analysis System (APAS) is a video-based 3D motion analysis system. APAS can capture video from multiple cameras simultaneously and perform a biomechanical analysis automatically.
  • 73

    Articles & Scientific Publications

    Ariel Dynamics and Dr. Gideon Ariel have been covered extensively in newspapers and magazines. We also published some of our scientific articles and system brochures. Enjoy!
  • 71

    Online Reference Library

    We helped athletes become world champions. We can help you improve your game too! Check the Ariel Library for more information.
  • 72

    Download our Applications

    All our Performance Analysis Applications can be downloaded from our website and evaluated free of charge. Our applications run on Microsoft Windows.
  • 74

    History of Biomechanics

    We are part of the history of modern biomechanics. Check out some of the media coverage over the years on ABC, CBS, CNN, ESPN, National Geographic, NBC and more. Shows are hosted by David Letterman, Tom Brokaw, and many others...

Online.

Statistical interpretation

Page
Published on Tuesday, May 27, 1997 by Gideon Ariel

Interpretation of Statistical Analysis

Reporting example

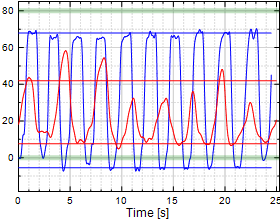
Consider the following example for Finger MP Flexion/Extension.

Chart Example: Finger MP Flexion/Extension
Table Example: Finger MP Flexion/Extension (F/E)
  A B C D E
  Range of Motion
[degrees]
F+
Left
E-
Left
F+
Right
E-
Right
1. Norm (mean) 80 0 80 0
2. Examinee Sample (mean) 67.9 -5.4 41.9 7.6
3. Standard Deviation (sd) 1.55 2.24 10.83 1.95
4. Range of Motion (rom) 73.3 73.3 34.3 34.3
5. Trial Consistency (sd/rom) 2.1% 3.1% 31.6% 5.7%
6. Degrees of Freedom (df) 9 8 7 6
7. H0: Examinee = Norm Reject Accept Reject Reject
8. Probability (p0) 0.00000 0.00004 0.00001 0.00002
9. Level of Confidence 99% 99% 99% 99%
10. H1: Side = Opposing Side Accept Accept Reject Reject
11. Probability (p1) 0.00000 0.00000 0.00000 0.00000

Explanation

This table can be interpreted as follows. Check with the chart to make sure the results are consistent.

# Description
5. Coefficient of Variation (COV) is defined as = "standard deviation / mean". Just by looking at the above equestion you'll see that the COV will get very large when the mean gets very small because it's in the denominator. This causes a significant bias. And it is dependent on how you happen to choose your coordinate system. We calculated it, put it in the reports, and studied the results. Then we rejected them and removed them. They are not a good measure of variability.

Instead we are reporting Trial Consistency which is defined as "standard deviation / range of motion". It lives on line 5. We believe this is a much more reliable measure to compare variability between different trials.

10. "Closeness" of left to right is included. It is expressed as hypothesis H1 with its result and corresponding probability in lines 10 (H1: Side = Opposing Side) and 11 (Probability p1). The hypothesis should really be phrased "Side is as good as opposing side" or "side is not worse than opposing side", but we thought these statements are too confusing.

The report shows the results of four statistical tests based on two samples each, their means, their pooled variance, confidence level, and the total degrees of freedom. Read it as follows and verify with Chart 11 to make sure the following conclusions are correct:

  • With 99% conf, Left Flexion is better than Right Flexion since it says Accept (a 0.00000 chance of diff due to chance).
  • With 99% conf, Left Extension is better than Right Extension since it says Accept (a 0.00000 chance of diff due to chance).
  • With 99% conf, Right Flexion is worse than Left Flexion since it says Reject (a 0.00000 chance of diff due to chance).
  • With 99% conf, Right Extension is worse than Left Extension since it says Accept (a 0.00000 chance of diff due to chance).
11.

Another way of interpreting this same information is the following (look at the bottom line probability p1):

  • "There is a 0.00000 probability that left flexion is as good as right flexion"
  • "There is a 0.00000 probability that left extension is as good as right extension"
  • "There is a 0.00000 probability that right flexion is as good as left flexion"
  • "There is a 0.00000 probability that right extension is as good as left extension"

This is under the assumptions that markers are placed symmetrically for left and right sides.

Reference: /wizard/manual/concepts/stats.table.html
Downloads - more...

Downloads.

Statistical interpretation

Home
APAS
  • Introduction
  • Features
  • Advantages
  • Gallery
  • Downloads
  • References
More...
ACES
  • Introduction
  • Features
  • Advantages
  • Exercises
  • References
  • Gallery
More...
Products
  • Downloads
  • Price List
  • Price List Academic
Library
  • Applications
  • Articles
  • Downloads
  • Journals
  • Presentations
  • Videos
More...
Company
  • About
  • Activities
  • Contact
  • Founder
  • History
  • Presentations
More...
Help
  • FAQ
  • KB
  • Tutorials
Personal
  • Books
  • Photo Galleries
Administration

Copyright © 1994 - 2025. Ariel Dynamics Inc. All rights reserved.
Generated on 6/2/2025 3:09:15 PM (PST) ADI/HQ/GBA/2025/ARIELCLOUD/v3.1.2022.1031.