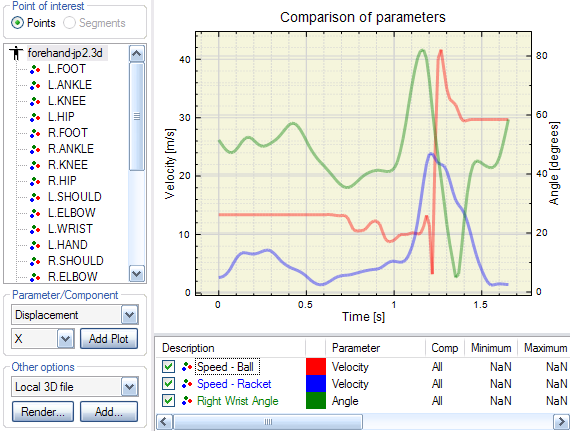
Advanced chart
The Advanced chart lets you compare different clues (from the same
data file, or from different data files). It consists of 3 major sections:
- A clue editor
- A list of clues
- A simple chart
Simple chart
A Simple chart allows visualization of one or more
clues in a chart. The example
below shows one clue (the speed of a tennis ball):
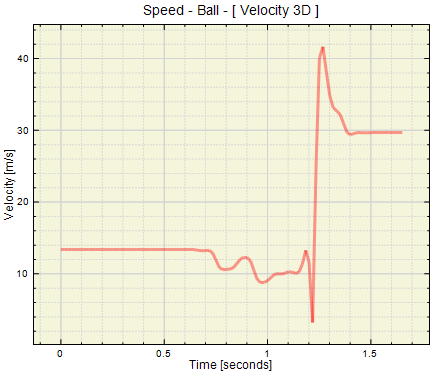
A simple chart contains the following elements:
- A title
- Gridlines (major and minor)
- Axis titles, usually "time" on the X-axis, and the clue's units on the
Y-axis.
- One or more curves representing how a clue's value (Y) changes as a function of X
(usually time).
The following functions are available in a simple chart:
| Function |
Description |
| Left mouse button |
Draw a rectangle inside the simple chart to "zoom in". |
| Right mouse button |
Reset the "zoom level" to default. |
See also